Working with the Report Designer
The Report Designer is used to create a layout of document templates of the Report type (or simply reports – see Adding/Editing Document Templates). When the Report Designer is started for a new report, the screen looks like this:
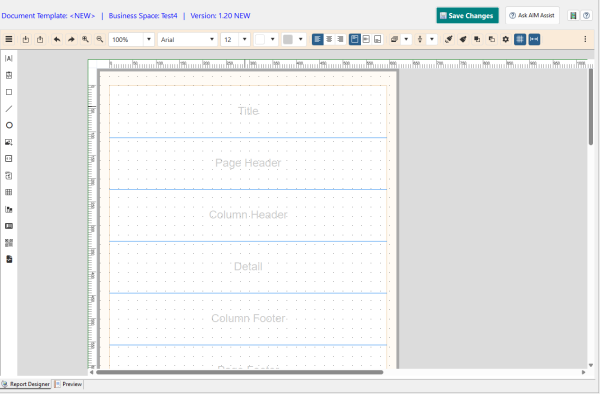
The working area consists of the Design Area (shown as the white rectangle), the left menu and the Report Designer toolbar. There are also optional horizontal and vertical rulers. AwareIM also displays a special window (not shown on the picture above) that represents the “Outline view” of the design, i.e. all elements that the report contains are listed in this window as textual entries.
The Design Area is broken into several sections or bands (they are shown as blue lines running across the Design Area). Each band has a special meaning and is processed in its own manner when the report is filled out with data at run time. Bands are explained in more detail in Report/Bands. The report is created by adding report elements to the appropriate bands in the Design Area – see |Adding Report Elements.
Reports are filled out with data at run time when the documents are generated from document templates (see Document Generation). The source of data is determined when a report is configured. The resulting documents are created in the Adobe PDF or HTML formats. There are some differences between the PDF and HTML formats. The differences are summarized below:
- While it is entirely possible and sometimes desirable to overlap different elements if your output is PDF, it is not recommended to overlap elements in HTML output – if you do only one of the overlapping elements will be shown.
- The PDF format only uses a handful of default fonts – if you want to use a different font it has to be imported as a custom font (see Adding Custom Font). In HTML fonts ultimately refer to the font available on the end user’s machine. Therefore you have to make sure that the end user’s machine has the font that you use when exporting to HTML.
It is worth repeating the first difference as a caution because it may severely impact how a report designated for HTML output is created:
warning
When designing reports for HTML output make sure that elements of the report do not overlap (this applies even to lines – make sure that they do not intersect or start/end at the same point). If they do, only one of the overlapping elements will be shown.See also: